The Consumer Price Index says inflation has cooled. Your grocery receipt says otherwise. Both are telling the truth, which is precisely the problem.
This disconnect—between what economists measure and what households feel—is not a failure of statistics or a mass delusion among consumers. It is a structural feature of how we quantify price changes, one that consistently understates the financial pressure on middle-income families while overstating it for the wealthy. Understanding this gap is essential to making sense of why inflation debates generate so much heat and so little light.
The arithmetic of averages
Inflation indices are weighted averages, and the weights matter enormously. The Bureau of Labor Statistics constructs the CPI by surveying what urban consumers buy, then tracking price changes in that basket. But the basket reflects aggregate spending patterns, not yours. If the average American household spends 6 percent of its budget on healthcare, that's the weight healthcare gets—even if your family, with a chronic condition and mediocre insurance, spends 15 percent.
This creates predictable distortions. Wealthier households spend proportionally more on services, travel, and durable goods whose prices have remained relatively stable or even fallen in quality-adjusted terms. Lower and middle-income households spend proportionally more on food, rent, utilities, and childcare—categories where prices have risen faster than the headline number suggests. The same 3 percent annual inflation rate can mean radically different things depending on where you sit in the income distribution.
The substitution problem
Economists build substitution effects into their models: when beef prices rise, consumers switch to chicken, and the index adjusts accordingly. This is mathematically defensible and experientially absurd. The index captures that you're still eating protein at roughly the same cost. It does not capture that you wanted a steak and settled for a drumstick. The statistical standard of living holds steady while the actual quality of life quietly erodes.
Housing presents an even thornier version of this problem. The CPI uses "owners' equivalent rent"—an estimate of what homeowners would pay to rent their own homes—rather than actual mortgage payments or home prices. This smooths volatility but disconnects the index from the experience of anyone trying to buy a first home or refinance at higher rates. For renters, the index lags actual market rents by months, sometimes years, because it tracks existing leases rather than new listings.
Frequency bias and psychological salience
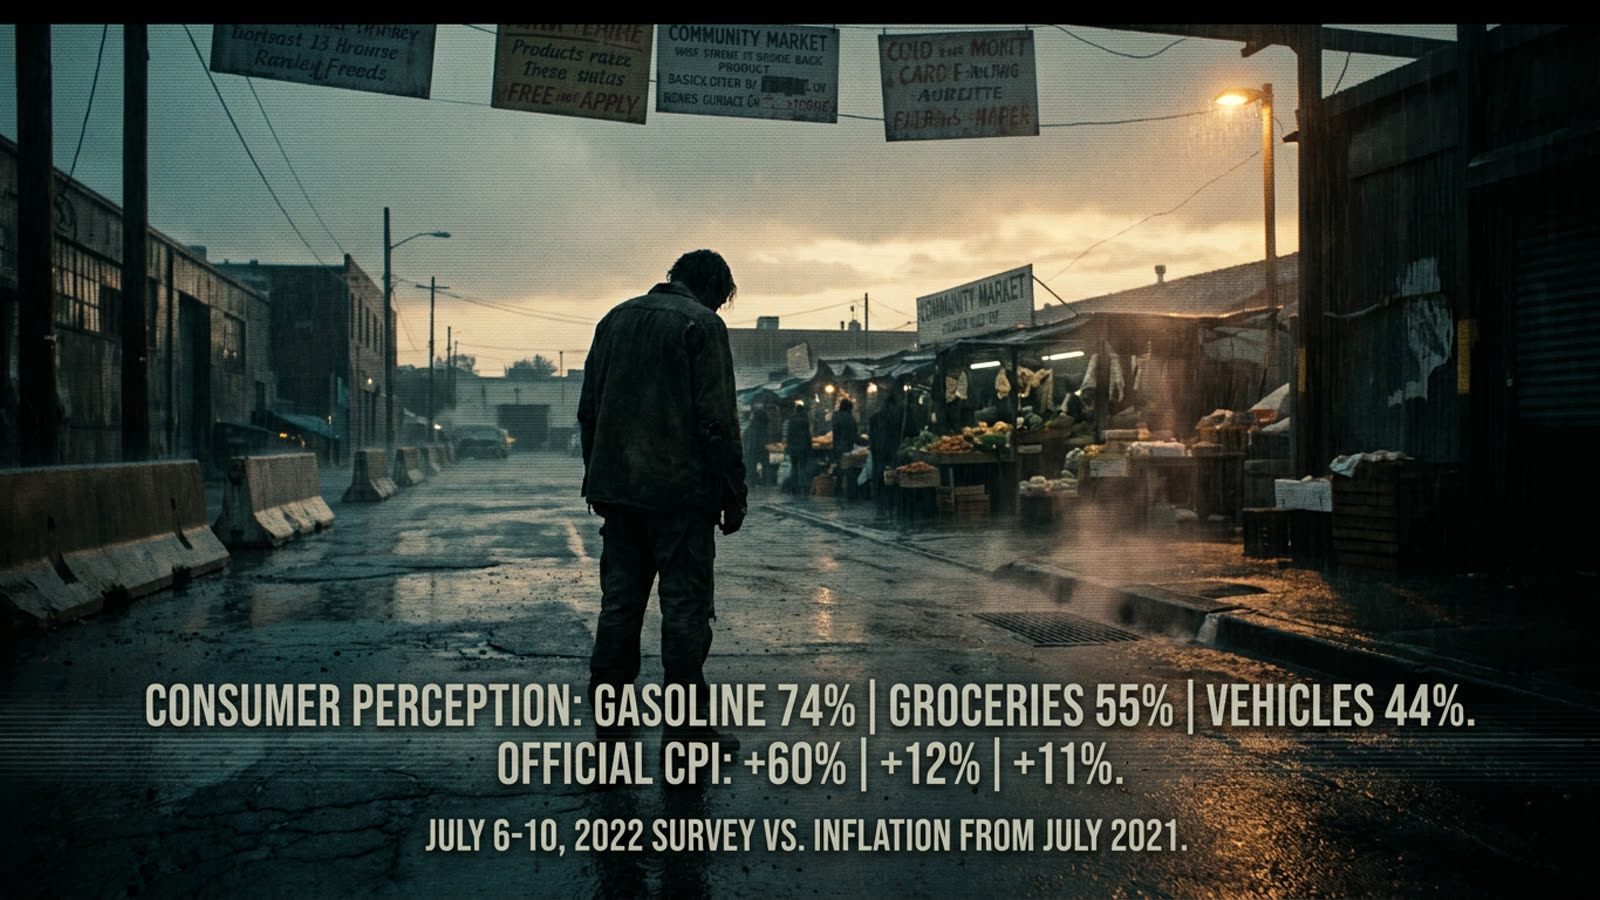
Humans do not experience inflation as an annual percentage. We experience it at the gas pump, the checkout line, the monthly rent payment. Items purchased frequently—groceries, fuel, coffee—loom larger in our perception than items purchased rarely, even if the rare items represent more total spending. A 20 percent increase in egg prices feels catastrophic; a 20 percent increase in the cost of a new refrigerator barely registers until the old one breaks.
This is not irrationality. It is a reasonable response to cash-flow constraints. Most households budget week to week, not year to year. A spike in grocery costs forces immediate trade-offs in a way that gradual increases in insurance premiums or subscription services do not, even when the latter add up to more money over time.
Our take
The inflation gap is not a bug in economic measurement; it is a feature of measuring something inherently unmeasurable—the cost of a life. Indices serve policymakers who need a single number to target. They serve markets that need a benchmark to price bonds. They do not serve the family trying to understand why the raise they received feels like a pay cut. The honest answer is that it might be one. Aggregate statistics describe economies. They do not describe your economy.